The daily updates on COVID-19 from the Florida Department of Health have come much later in recent days.
On Sunday, the daily report updated with new numbers after 9 p.m. On Monday, the update came around 2:30 p.m. It showed more than 6,000 additional coronavirus tests had come back positive.
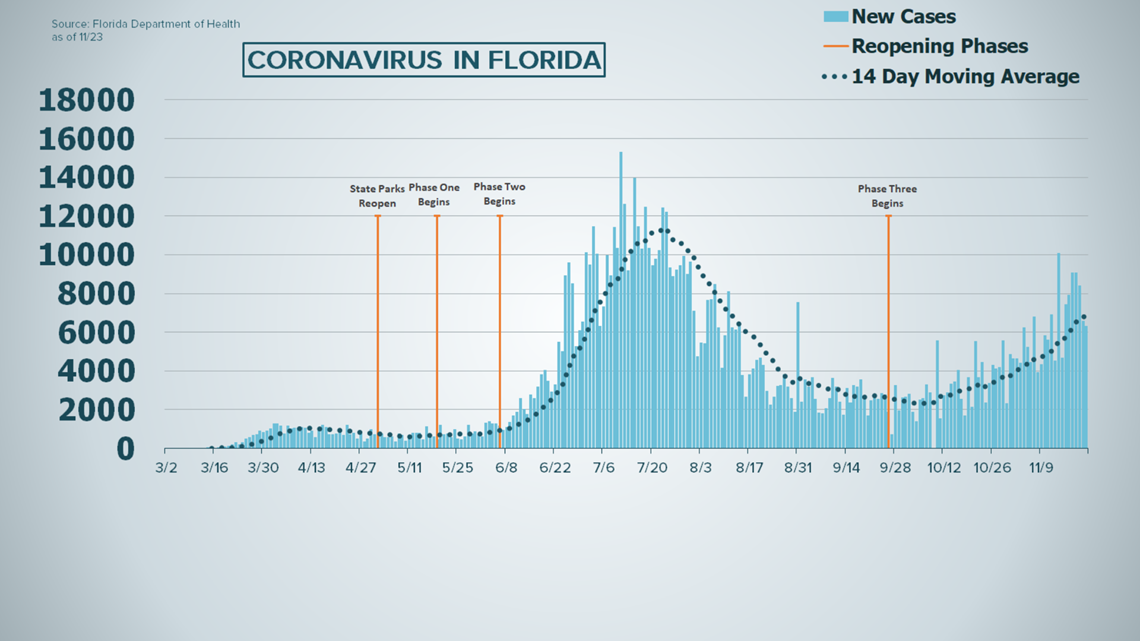
With the state's report showing 6,331 new cases for Nov. 22, the statewide case total now stands at 944,745 since tracking began in March.
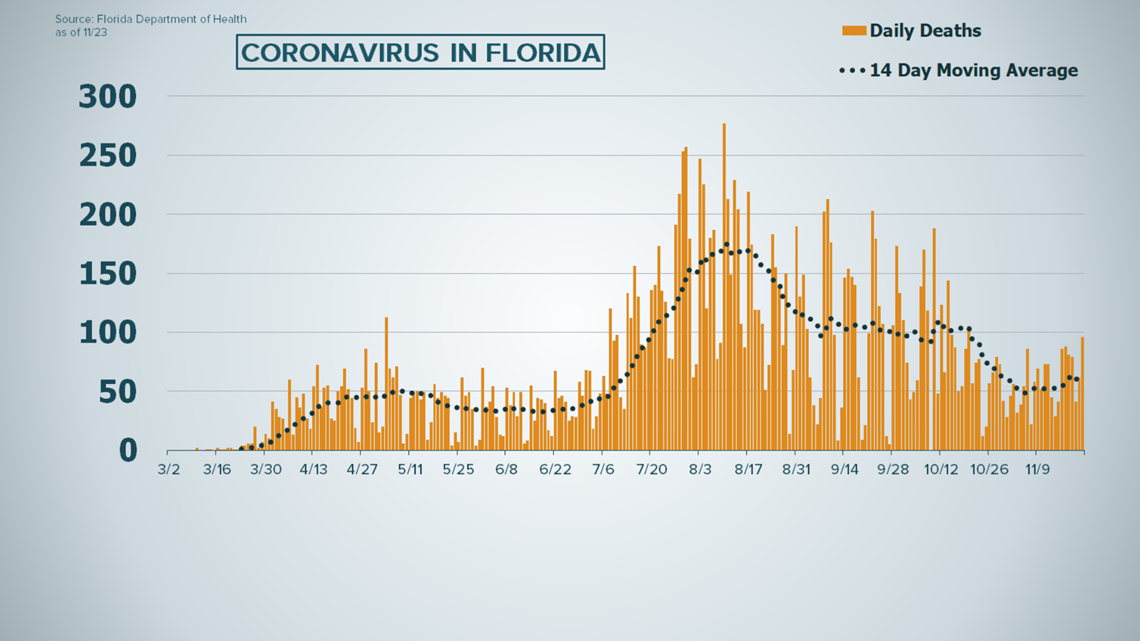
Florida also reported another 94 Floridians and two non-residents had died after testing positive for COVID-19. That brings the total to 18,085 residents and 225 non-residents who have died since the pandemic began -- a total of 18,310 deaths in the state.
Those numbers do not necessarily mean those people died Sunday, but rather the state learned of their deaths and added the number to the report that day. The state's line-by-line report, which you can read here, lists coronavirus deaths by the date the people tested positive for the virus, not the date they passed.


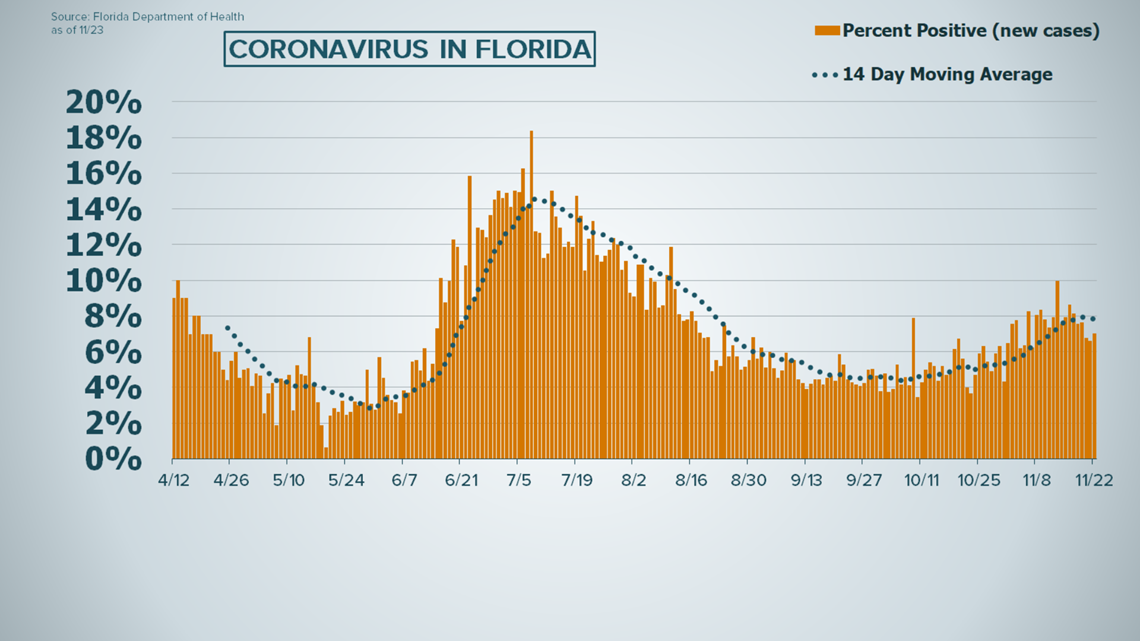
When it comes to testing, the health department reported 7.01 percent of 95,791 test results returned from labs were positive for coronavirus through Nov. 22. For context, Florida has conducted 1,370,573 tests in the last two weeks. That's among the most for any two-week period since the pandemic began.
The median age of Floridians testing positive is 40.
As for hospitalizations, 3,758 people in Florida were hospitalized with coronavirus as their primary diagnosis as of Monday afternoon. Of those, 1,002 patients were in the Tampa Bay area.
That's the fifth day in a row the Tampa Bay area has seen more than 900 people hospitalized with the virus since mid-August.
Statewide, a total of 53,499 people in Florida have been hospitalized with the virus at some point during the pandemic.


Here's a breakdown of new coronavirus cases reported to the state:
- June 21: 2,926
- June 22: 3,286
- June 23: 5,508
- June 24: 5,004
- June 25: 8,942
- June 26: 9,585
- June 27: 8,530
- June 28: 5,266
- June 29: 6,093
- June 30: 6,563
- July 1: 10,109
- July 2: 9,488
- July 3: 11,458
- July 4: 10,059
- July 5: 6,336
- July 6: 7,347
- July 7: 9,989
- July 8: 8,935
- July 9: 11,433
- July 10: 10,360
- July 11: 15,300
- July 12: 12,624
- July 13: 9,194
- July 14: 10,181
- July 15: 13,965
- July 16: 11,466
- July 17: 10,328
- July 18: 12,478
- July 19: 10,347
- July 20: 9,440
- July 21: 9,785
- July 22: 10,249
- July 23: 12,444
- July 24: 12,199
- July 25: 9,344
- July 26: 8,892
- July 27: 9,230
- July 28: 9,446
- July 29: 9,956
- July 30: 8,989
- July 31: 9,643
- August 1: 7,104
- August 2: 4,752
- August 3: 5,446
- August 4: 5,409
- August 5: 7,650
- August 6: 7,686
- August 7: 8,502
- August 8: 6,229
- August 9: 4,155
- August 10: 5,831
- August 11: 8,109
- August 12: 6,236
- August 13: 6,148
- August 14: 6,352
- August 15: 3,779
- August 16: 2,678
- August 17: 3,838
- August 18: 4,115
- August 19: 4,555
- August 20: 4,684
- August 21: 4,311
- August 22: 2,974
- August 23: 2,258
- August 24: 2,673
- August 25: 3,220
- August 26: 3,269
- August 27: 3,815
- August 28: 3,197
- August 29: 2,583
- August 30: 1,885
- August 31: 7,569 (Quest Diagnostics backlog)*
- September 1: 2,402
- September 2: 3,571
- September 3: 3,198
- September 4: 3,656
- September 5: 2,564
- September 6: 1,838
- September 7: 1,823
- September 8: 2,056
- September 9: 2,583
- September 10: 3,650
- September 11: 3,190
- September 12: 2,423
- September 13: 1,736
- September 14: 3,116
- September 15: 2,355
- September 16: 3,255
- September 17: 3,204
- September 18: 3,573
- September 19: 2,521
- September 20: 1,685
- September 21: 2,470
- September 22: 2,590
- September 23: 2,541
- September 24: 2,847
- September 25: 2,795
- September 26: 1,882
- September 27: 738
- September 28: 3,266
- September 29: 1,948
- September 30: 2,628
- October 1: 2,660
- October 2: 2,811
- October 3: 1,868
- October 4: 1,415
- October 5: 2,241
- October 6: 2,582
- October 7: 3,306
- October 8: 2,908
- October 9: No daily report due to Dept. of Health technical issue*
- October 10: 5,570
- October 11: 1,533
- October 12: 2,725
- October 13: 2,883
- October 14: 3,356
- October 15: 3,449
- October 16: 4,044
- October 17: 2,539
- October 18: 1,707
- October 19: 3,662
- October 20: 2,145
- October 21: 5,557
- October 22: 3,689
- October 23: 4,471
- October 24: 2,385
- October 25: 3,377
- October 26: 4,298
- October 27: 4,115
- October 28: 4,198
- October 29: 5,592
- October 30: 2,331
- October 31: 4,865
- November 1: 4,651
- November 2: 4,637
- November 3: 4,423
- November 4: 6,257
- November 5: 5,245
- November 6: 4,452
- November 7: 6,820
- November 8: 3,924
- November 9: 4,353
- November 10: 5,838
- November 11: 5,607
- November 12: 6,933
- November 13: 4,544
- November 14: 10,105
- November 15: 4,663
- November 16: 7,459
- November 17: 7,925
- November 18: 9,085
- November 19: 9,085
- November 20: 8,410
- November 21: 6,586
- November 21: 6,221


Breaking down the numbers
Since mid-July, daily reported COVID-19 cases in Florida remained under 10,000. And, between Sept. 1 and Oct. 16, daily reported cases stayed below 4,000.
That changed on Nov. 15, when the state reported 10,105 new cases for the day prior.
The highest single-day case number Florida has reported so far is 15,300 for July 11. The lowest single-day case number the state has reported since early June is 738 confirmed on Sept. 28.
On Oct. 30, Florida became the third state to cross the 800,000 reported COVID-19 cases mark. As of Nov. 20, Texas and California reported more than 1 million cases, according to Johns Hopkins University & Medicine.
The state's report released on Aug. 11 of 277 newly confirmed deaths was the highest seen from the state in a single day's report.
According to Johns Hopkins University of Medicine, the United States has more than 12 million coronavirus cases as of Nov. 21, the highest recorded number in the world.
The state recently added a section to its daily report (on page 5) that shows deaths by date of death. This data has been reported daily on Florida's COVID-19 dashboard. The graph for deaths by date of death is subject to change, though, because the information reported to the state can be delayed up to two weeks. So, for consistency, our charts have stuck to new deaths added by the date they were added. For transparency, you can always reference the state's data here.
The positivity rate is crucial for reopening. The World Health Organization has repeatedly said it must remain at 5 percent or lower for a 14-day span for the agency to recommend reopening.
However, it can be somewhat misleading: The number of people tested statewide varies each day, and recently the percent positive has ranged from above 6 percent to nearly 10 percent.
Health officials say they would like to see a high -- but steady -- number of people tested every day and a suppressed percent positivity figure.
Until Aug. 21, Florida had not seen a positivity rate at 5 percent since the beginning of June. In July, the state reported positivity rates at double and even triple that recommended percentage.
The reports for Aug. 1 and 2, respectively, showed positivity rates below 10 percent for the first time since June 24. The positivity rate reported for Oct. 3 (3.74 percent) is the lowest Florida has seen since early June.
So far in November, the percent positive rate reported daily hasn't been below 6 percent.
Florida has been in "Phase 3" of reopening since Sept. 25, when Gov. Ron DeSantis signed an order guaranteeing restaurants the right to operate and lifting state-level capacity restrictions on them.
Hospitalizations and ICU bed availability
New cases have dropped significantly in recent months, but what about hospitalizations?
Tracking hospitalizations got easier on July 10 when the Agency for Health Care Administration began publishing a spreadsheet with the number of people currently checked-in for coronavirus-related complications in Florida. The data only includes people whose "primary diagnosis" was COVID-19.
As of Nov. 23, 3,758 people were hospitalized with COVID-19 as their primary diagnosis statewide, and 1,002 of them were in the Tampa Bay area. Those numbers are frequently updated, and you can click here for the most recent data, which is also broken down by county.
Since the pandemic began, the state confirms a total of 53,499 residents were hospitalized at some point during their illness.
The Agency for Healthcare Administration (AHCA) also updates total hospital bed and ICU availability by county.
Click here for a breakdown of adult and pediatric ICU bed availability by county. You can also check ICU availability by the hospital.
Hospitalizations around Tampa Bay and total staffed hospital bed capacity status:
**Data as of 3:00 p.m. Nov. 23, 2020.
Citrus:
- 60 COVID-19 hospitalizations
- 70 of 298 total staffed hospital beds are available
DeSoto:
- 20 COVID-19 hospitalization
- 16 of 62 total staffed hospital beds are available
Hardee:
- 0 COVID-19 hospitalizations
- 0 of 25 total staffed hospital beds are available
Hernando:
- 56 COVID-19 hospitalizations
- 209 of 741 total staffed hospital beds are available
Highlands:
- 62 COVID-19 hospitalizations
- 58 of 261 total staffed hospital beds are available
Hillsborough:
- 263 COVID-19 hospitalizations
- 913 of 4,179 total staffed hospital beds are available
Manatee:
- 45 COVID-19 hospitalizations
- 110 of 750 total staffed hospital beds are available
Pasco:
- 103 COVID-19 hospitalizations
- 285 of 1,426 total staffed hospital beds are available
Pinellas:
- 183 COVID-19 hospitalizations
- 1,001 of 3,232 total staffed hospital beds are available
Polk:
- 111 COVID-19 hospitalizations
- 418 of 1,678 total staffed hospital beds are available
Sarasota:
- 99 COVID-19 hospitalizations
- 143 of 1,233 total staffed hospital beds are available

